QtRPT
Structure of the report’s XML
The common structure of the report's XML file is very simple. There are five kind of nodes are used in XML files: <reports>, <report>, <ReportBand>, <TContainerField>, <DataSource> and <graph>.
<reports>
   <report>
      <ReportBand>
         <TContainerField>
         </TContainerField>
      </ReportBand>
      <ReportBand>
         <TContainerField>
         </TContainerField>
         <TContainerLine>
         </TContainerLine>
         <TContainerField type=”diagram”>
               <graph>
               </graph>
               <graph>
               </graph>
         </TContainerField>
      </ReportBand>
      <DataSource>
         <diagram>
         </diagram>
      </DataSource>
   </report>
</reports>
The root node is <reports>. The root node <reports> may contain several different report’s node,
so user can aggregate several reports into one XML file.
The <report> may contain up to 9 child nodes <ReportBand> . ReportBand may be one of following type:
- ReportTitle
- PageHeader
- DataGroupHeader
- MasterHeader
- MasterData
- MasterFooter
- DataGroupFooter
- ReportSummary
- PageFooter
Purpose and description of the bands by priority.
- The PageHeader band printing at the top on the each page of the report.
- The ReportTitle band is a first band which printing at the report. It’s printing only one and just on the first page.
- The DataGroupHeader band is indented for group of data. Printed before MasterData band before each group of data.
- The MasterHeader band printing before MasterData band on each page of the report (if data present on the current page). Inside or not of each of data group (depending of appropriate parameter ShowInGroup).
- The MasterData is a main band which in the circle prints data received from your application.
- The MasterFooter band is a band which always follows after a MasterData band. Inside or not of each of data group (depending of appropriate parameter ShowInGroup).
- The DataGroupFooter band is indented for group of data. Printed after MasterData band after each group of data.
- The ReportSummary band is a conclusion of the report, its printing at the bottom of the last page of the report (but before PageFooter).
- The PageFooter band printing at the bottom on each page of the report.
Each ReportBand node may contain <TContainerField> node. The purpose of <TContainerField> is display any kind of information which necessary to user. The node <graph> holds the information about each graph of the diagram. This node only child of the <TContainerField> type=”diagram”
To control of rendering process, each node has own set of attributes.
Note: All measurements such as page width, page height, etc. are made in points. To correct correlate the real size of paper and pixels, necessary to observe a ratio: 1 cm is 40 points
Note: All colors are encoded as following rgba(100,100,100,255). Where the first digit is red, second is green, third is blue, and last one is transparency. When you need to make some thinks invisible, please use the following values rgba(255,255,255,0). This means “White” color and full transparency.
The <report> also may contain node <DataSource>. This node contain info about connection to DS
| Node type |
Attribute |
Permitted values (type) |
Purpose |
Remark |
| <reports> |
programmer |
string |
Name of programmer |
|
| |
email |
string |
Email of programmer |
|
| |
lib |
QtRPT |
Name of lib |
|
| <report> |
orientation |
0 - portrait; 1 - landscape |
Orientation of the page |
|
| |
pageWidth |
integer |
Page width |
|
| |
pageHeight |
integer |
Page height |
|
| |
marginsLeft |
integer |
Left margins |
|
| |
marginsRight |
integer |
Right margins |
|
| |
marginsTop |
integer |
Top margins |
|
| |
marginsBottom |
integer |
Bottom margins |
|
| |
pageNo |
integer |
Page’s number |
|
| |
border |
integer, 0 – is false; 1 – is true |
Draw or not border on the page |
|
| |
borderWidth |
integer |
Border width |
|
| |
borderColor |
string |
Border color |
|
| |
borderStyle |
string |
Border style |
|
| <ReportBand> |
height |
integer |
Band's height |
|
| |
type |
- ReportTitle
- ReportSummary
- PageHeader
- PageFooter
- MasterHeader
- MasterData
- MasterFooter,
- DataGroupHeader
- DataGroupFooter
|
Report's type |
|
| |
name |
string |
Report's name |
|
| |
groupingField |
string |
Field on which the group of data is carried out |
Just for DataGroupHeader |
| |
startNewNumeration |
integer, 0 – is false; 1 – is true |
Start or not new numeration for the group |
Just for DataGroupHeader |
| |
showInGroup |
Integer, 0 – is false; 1 – is true |
Show band inside of Data group |
Just for MasterHeaderBand and MasterFooterBand |
| <TContainerField> |
top |
integer |
Top position of the container |
|
| |
left |
integer |
Left position of the container |
|
| |
width |
integer |
Width of the container |
|
| |
height |
integer |
Height of the container |
|
| |
type |
string
- label
- richText
- labelImage
- image
- diagram
- reactangle
- roundedReactangle
- circle
- triangle
- rhombus
- barcode
- databaseimage
|
Type of the container |
|
| |
value |
string with value To display in the current field |
Visible value of the container |
|
| |
name |
string |
Container's name |
|
| |
fontBold |
integer, 0 - is false; 1 - is true |
Font’s param |
|
| |
fontItalic |
integer, 0 - is false; 1 - is true |
font’s param |
|
| |
fontUnderline |
integer, 0 - is false; 1 - is true |
font’s param |
|
| |
fontStrikeout |
integer, 0 - is false; 1 - is true |
font’s param |
|
| |
fontColor |
string, encoded value, see Note above |
font’s color |
|
| |
fontFamily |
The valid font family name |
font’s family |
|
| |
fontSize |
integer |
font’s size |
|
| |
aligmentH |
- hLeft
- hRight
- hCenter
- hJustify
|
Horizontal alignment |
|
| |
aligmentV |
|
Vertical alignment |
|
| |
backgroundColor |
string, encoded value, see Note above |
Background color |
|
| |
borderColor |
string, encoded value, see Note above |
Border color |
|
| |
borderLeft |
string, encoded value, see Note above |
|
|
| |
borderRight |
string, encoded value, see Note above |
|
|
| |
borderTop |
string, encoded value, see Note above |
|
|
| |
borderBottom |
string, encoded value, see Note above |
|
|
| |
borderWidth |
integer |
Width of the border |
|
| |
borderStyle |
string:
- solid
- dashed
- dotted
- dot-dash
- dot-dot-dash
|
|
|
| |
picture |
String, which must contains 84 bit base array. |
Image information |
For type Image only |
| |
printing |
integer, 0 - is false; 1 - is true |
Printable(visible) or not field |
|
| |
highlighting |
string: |
|
|
| |
format |
string |
Format of number value |
|
| |
showGrid |
integer, 0 - is false; 1 - is true |
Show or not grid |
For type Diagram only |
| |
showLegend |
integer, 0 - is false; 1 - is true |
Show or not legend |
For type Diagram only |
| |
showCaption |
integer, 0 - is false; 1 - is true |
Show or not diagram caption |
For type Diagram only |
| |
showGraphCaption |
integer, 0 - is false; 1 - is true |
Show or not Graph caption |
For type Diagram only |
| |
showPercent |
integer, 0 - is false; 1 - is true |
Show percent or real value |
For type Diagram only |
| |
caption |
string |
Diagram caption |
For type Diagram only |
| |
autoFillData |
integer, 0 - is false; 1 - is true |
Use manual data for graphs or use aggregate values |
For type Diagram only |
| |
autoHeight |
integer, 0 - is false; 1 - is true |
Stretch height of the fields and band to fit all text |
Applicable only for fields which placed on MasterDataBand |
| |
imgFormat |
string |
Holds the extension of image format |
For type Image only |
| |
ignoreAspectRatio |
integer, 0 - is false; 1 - is true |
Ignore or not aspect ratio for image |
For type Image only |
| |
barcodeType |
integer |
Type of the barcode |
For type Barcode only |
| |
barcodeFrameType |
Integer:
|
Type of the frame of barcode |
For type Barcode only |
| |
barcodeHeight |
integer |
Height of the barcode |
For type Barcode only |
| |
textWrap |
integer, 0 - is false; 1 - is true |
Wrap or not text |
For type Text only |
| |
|
|
|
|
| <TContainerLine> |
top |
integer |
Top position of the container |
Always -10 |
| |
left |
integer |
Left position of the container |
Always -10 |
| |
width |
integer |
Width of the container |
Always -20 |
| |
height |
integer |
Height of the container |
Always -20 |
| |
type |
string
|
|
|
| |
name |
string |
Container's name |
|
| |
borderColor |
string, encoded value, see Note above |
Line color |
|
| |
borderStyle |
string:
- solid
- dashed
- dotted
- dot-dash
- dot-dot-dash
|
Line style |
|
| |
borderWidth |
integer |
Width of the line |
|
| |
printing |
integer, 0 - is false; 1 - is true |
Printable(visible) or not field |
|
| |
lineStartX |
integer |
X of line start |
|
| |
lineStartY |
integer |
Y of line start |
|
| |
lineEndX |
integer |
X of line end |
|
| |
lineEndY |
integer |
Y of line end |
|
| |
arrowStart |
integer, 0 - is false; 1 - is true |
Draw arrow at the start |
|
| |
arrowEnd |
integer, 0 - is false; 1 - is true |
Draw arrow at the end |
|
| <graph> |
caption |
string |
Graph caption |
|
| |
value |
string |
Holds the name of field or aggregate functions |
For automatic calculation |
| |
color |
string, encoded value, see Note above |
Color of the graph |
For automatic calculation |
| <DataSource> |
|
string |
Node holds the sql query |
|
| |
type |
string: SQL |
Type of DS |
|
| |
name |
string |
Name of DS |
|
| |
dbType |
string |
Name of the SQL driver |
|
| |
dbName |
string |
Name of DB |
|
| |
dbHost |
string |
Host address |
|
| |
dbUser |
string |
User name |
|
| |
dbPassword |
string |
Password |
|
| |
dbCoding |
string |
Coding of DB connection |
|
| |
charsetCoding |
string |
Coding of query charset |
|
| |
dbPort |
integer |
Number of port |
|
| |
dbConnectionName |
String |
Name of DB connection |
|
| <diagram> |
|
|
Holds Diagram of SQL Designer |
|
| |
|
|
|
|
QtRPT project folder’s structure
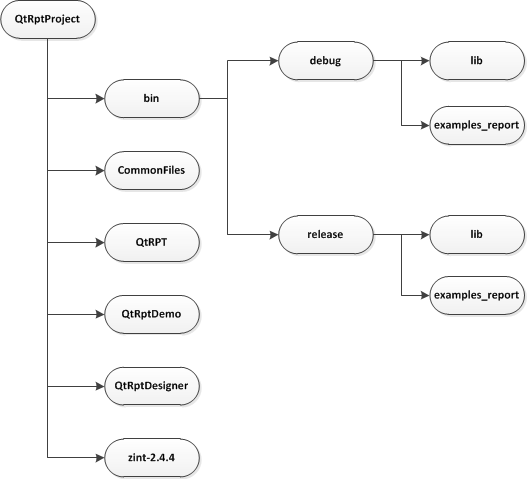
The QtRptProject’s folder holds the following sub-directories:
- bin. Holds all files which are built after compilation, also this folder holds all files necessary for the correct operation of application. Respectively the debug and release versions of files are put in the corresponding folder. The folder “lib” holds library files after building of the library (zint). Folder “examples_report” holds the XML demo files.
- CommonFiles. Holds all common files used by all projects.
- QtRPT. Holds source files relating to QtRPT.
- QtRptDemo. Holds source files relating to Demo
- QtRptDesigner. Holds source files relating to QtRptDesigner
- zint-2.4.4. Holds source files relating to Zint library. It is a third party project
How to use it.
Please, note, that from version 1.4.5 all parts of the project (QtRptDemo, QtRptDesigner, third parties) united in one folder. To build simultaneously all parts of the project, you must use QtRptProject.pro file. In this case all binary files (QtRptDemo, QtRptDesigner, third party library (Zint)) will be built in ./bin/(debug or release) folder depends of building mode.
The folder of destination you may indicate in the file config.pri. To change it, open config.pri which located in QtRPT folder of the project. Locate the following lines
CONFIG(debug, debug|release) {
    DEST_DIRECTORY = $$PWD/bin/debug
}
CONFIG(release, debug|release) {
    DEST_DIRECTORY = $$PWD/bin/release
}
The variable DEST_DIRECORY specifies where there will be binary files after compilation. The path of linking to the Zint library also depends from this variable. If you have folders of your project on another, please make sure that at you ways are correctly specified everywhere.
Also you may build any part of the project separately, if you need it you may do it by opening QtRptDemo.pro or QtRptDesigner.pro or Zint.pro in appropriate folder.
Please note that from version 1.4.5 the using of barcode feature you need build Zint library. I.e. before building of you own project you must have the following files in /bin/(debug/release/lib)
If you don’t need barcode feature at all, you may set it in config.pri file
DEFINES += NO_BARCODE
In this case, the building will be carry out without Zint library features.
Config.pri file
There are a few options possible to set in config.pri
   DEFINES += QTRPT_LIBRARY #Un-remark this line, if you want to build QtRPT as a library
   DEFINES += NO_BARCODE
   DEFINES += QXLSX_LIBRARY
Building QtRPT as a library
If you want, you may also buld QtRPT as library. For this, un-comment in the config.pri file
#DEFINES += QTRPT_LIBRARY
And include the QtRPT.pro in your project. Also in your project file you must add the following lines
contains(DEFINES,QTRPT_LIBRARY) {
    INCLUDEPATH += $$PWD/../QtRPT/
    LIBS += -L$${DEST_DIRECTORY}/lib –lQtRPT
}
Using QtRPT in your project.
For novice and easy-of-using of QtRPT please use the following folder’s structure
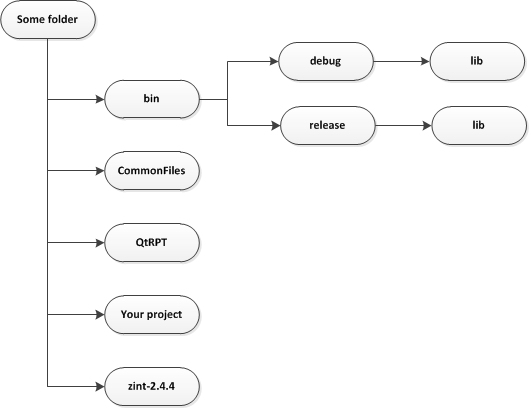
The people how have experience in using of third-party libraries and changes of dependences between projects may use own folder’s structure.
First of all, you must add to your project the QtRPT.pri file. As in the example add the following line to your project.pro file.
include(../QtRPT/QtRpt.pri)
Then, correct the folder of destination as described above (config.pri file).
Second, we creates QtRPT object. Let's assume that
buttonPrintClicked is a slot which connected with the
"Print" button. So, all code of creating QtRPT object, loading report and showing preview will be as bellow
void MainWindow::buttonPrintClicked()
{
     QString fileName = "mydocument.xml";
     QtRPT *report = new QtRPT(this);
     report->loadReport(fileName);
     report->recordCount << ui->tableWidget->rowCount();
     QObject::connect(report, SIGNAL(setValue(const int, const QString, QVariant&, const int)),
			this, SLOT(setValue(const int, const QString, QVariant&, const int)));
     report->printExec();
  }
Let's consider in more detail.
1a. Create a QtRPT object by classic way
QtRPT *report = new QtRPT(this);
1b. Create a QtRPT object as a QSharedPointer by static function. Since 2.0.1 version
auto report = QtRPT::createSPtr(this);
2. Load a report’s XML file
report->loadReport(fileName);
3. Set up the record count.
How many times the Master Data band will display data of field fitted on it depends on record count. For example, if you want to show in Master Data band all data stored in QTableWidget, so, recordCount in QtRPT must be equal to rowCount of QTableWidget.
Attention!!! From the version 1.1.0, the recordCount is a list of integer. You must append to the list records count of each datasource (report pages).
//OLD VERSION
report->recordCount = ui->tableWidget->rowCount();

//NEW VERISION
report->recordCount << ui->table1->rowCount();
report->recordCount << ui->table2->rowCount();
4. Connect signal of QtRPT with the appropriate slots for pass data to report.
Pass text, integer, etc. data
QObject::connect(report, SIGNAL(setValue(const int, const QString, QVariant&, const int)),
                 this, SLOT(setValue(const int, const QString, QVariant&, const int)));
Pass image data
QObject::connect(report, SIGNAL(setValueImage(const int, const QString, QImage&, const int)),
                 this, SLOT(setValueImage(const int, const QString, QImage&, const int)));
5. Before run the report, you may insert a background image
report->setBackgroundImage(QPixmap("./qt_background_portrait.png"));
6. Print or Show preview of the report
You may open preview of the report in maximize or fitted mode; Or you can print report without preview;
By default is a fitted mode and open with preview dialog and with use default printer;
report->printExec();
To open preview in maximize mode, you may write as following
report->printExec(true,false);
To direct printing without preview dialog
report->printExec(true,true);
To set the printer for use you may use the command as bellow. If printer with the name is not valid, the default printer will be used.
report->printExec(true,false,”name_of_the printer”);
To direct printing to Pdf file you may use the following function
report->printPdf("file_name_with_path", true);
The first param is a file name with a path. The second param indicates open or not after printing a pdf file in the associated application.
7. Get data into report
We need defined a slot, which will a pass our data to the report during execution. We pass the data via appropriate reference variable.
- const int recNo is a current record in the Master Data band
- const QString paramName is a param name which currently rendering
- QVariant ¶mValue - value of the current param returned to print engine
- const int reportPage is a current reportPage (page of the report - not printing page)
For example, if current paramName is "Goods" (defined in the report), we look at the QTableWidget the row with the number recNo and return paramValue.
if (paramName == "Goods") {
   if (ui->tableWidget->item(recNo,0) == 0) return;
   paramValue = ui->tableWidget->item(recNo,0)->text();
}
Slot setValue from the example project.
void MainWindow::setValue(const int recNo, const QString paramName,
QVariant ¶mValue, const int reportPage)
{
if (paramName == "customer")
paramValue = ui->edtCustomer->text();
if (paramName == "date")
paramValue = ui->dtp->date().toString();
if (paramName == "NN")
paramValue = recNo+1;
if (paramName == "Goods") {
if (ui->tableWidget->item(recNo,0) == 0) return;
paramValue = ui->tableWidget->item(recNo,0)->text();
}
if (paramName == "Quantity") {
if (ui->tableWidget->item(recNo,1) == 0) return;
paramValue = ui->tableWidget->item(recNo,1)->text();
}
if (paramName == "Price") {
if (ui->tableWidget->item(recNo,2) == 0) return;
paramValue = ui->tableWidget->item(recNo,2)->text();
}
if (paramName == "Sum") {
if (ui->tableWidget->item(recNo,3) == 0) return;
paramValue = ui->tableWidget->item(recNo,3)->text();
}
}
Slot setValueImage from the example project.
void MainWindow::setValueImage(int &recNo, QString ¶mName, QImage ¶mValue, int reportPage)
{
if (paramName == "image") {
QImage *image = new QImage(QCoreApplication::applicationDirPath()+"/qt.png");
paramValue = *image;
}
}
8. Get full control of report building
Since version 1.4.5 there are possible take a full control of report building from user application. You may change any parameter of any object of the report. Moreover, you may build your report without XML file. Take a look at exampledlg14.cpp
QtRPT *report = new QtRPT(this);

//Make a page of report
RptPageObject *page = new RptPageObject();
page->pageNo=0;
report->pageList.append(page); //Append page to the report

//Make a ReportTitleBand
RptBandObject *band1 = new RptBandObject();
band1->name = "ReportTitle";
band1->height = 80;
band1->type = ReportTitle;
page->addBand(band1); //Append band to the page

//Make a field
RptFieldObject *field1 = new RptFieldObject();
field1->name = "field1";
field1->fieldType = Text;
field1->rect.setTop(0);
field1->rect.setLeft(0);
field1->rect.setHeight(60);
field1->rect.setWidth(700);
field1->font.setBold(true);
field1->font.setPointSize(24);
field1->aligment = Qt::AlignCenter;
field1->textWrap = 1;
field1->value = "Creation of the report from user application without XML file";
field1->borderLeft = Qt::white;
field1->borderRight = Qt::white;
field1->borderBottom = Qt::white;
field1->borderTop = Qt::white;
band1->addField(field1);  //Append field to the ReportTitleBand
report->recordCount << 4;

QObject::connect(report, SIGNAL(setField(RptFieldObject &)), this, SLOT(setField(RptFieldObject &)));

report->printExec();
Now we have a new SIGNAL setField(RptFieldObject &). This signal emits before signal setValue, which were described above. The signal setField pass to user application a RptFieldObject which represents a field on the band. Changing the properties of this object, you can change any parameter of the field. To make so that the field looked as it is necessary for you.
From RptFieldObject, you may have access to the parent RptBandObject and from it to parent RptPageObject. For more information please take a look to the API of the class.
Diagrams
There are two modes getting data for diagram: Manual and on the basis of aggregate functions. Manual mode it is when user in the application form each element and its property of diagram. The properties are color, caption, value. In the mode on the basis of aggregate function, the all properties are sets directly in the report.
9. Manual setting data for Diagram
To use the diagram in manual mode, we need defined a slow, which will pass diagram’s data to the report during execution. We pass the data via appropriate reference variable.
Chart &chart is a object which holds a diagram.
Let look at the example 7. First of all, we check that chart’s name is a diagram1. Next, we create a a struct GraphParam, which holds data for each Graph of the diagram. The GraphParam has the following fileds:
| Type |
name |
description |
| QColor |
color |
Color of the graph |
| float |
valuePercent |
value as a percentage. Just for inner using |
| float |
valueReal |
Value pass to graph by application |
| QString |
caption |
Caption of the graph (legend) |
Each GraphParam pass to the chart by function chart.setData(param);
In the XML file of report, if the Diagram’s Graph caption parameter set to “Real value” it is enough. In this case the highest of the graph will be graph with the biggest value.
If the Diagram’s Graph caption parameter set to “Percent value”, the biggest value will
correspondents to 100%. To have possibilities display value more than 100%, you must defined the value for 100%.
You must to do it in the last pass data to the diagram. For example:
chart.setData(param,150);
The 100% of the will correspondents with a 150 of value.
void ExampleDlg7::setValueDiagram(Chart &chart)
{
    if (chart.objectName() == "diagram1") {
        GraphParam param;

        param.color = colorFromString("rgba(255,255,0,255)");
        param.valueReal = 150;
        param.caption = "Graph 1";
        chart.setData(param);

        param.color = colorFromString("rgba(0,0,255,255)");
        param.valueReal = 70;
        param.caption = "Graph 2";
        chart.setData(param);

        param.color = colorFromString("rgba(255,0,0,255)");
        param.valueReal = 220;
        param.caption = "Graph 3";
        chart.setData(param);

        param.color = colorFromString("rgba(0,128,128,255)");
        param.valueReal = 30;
        param.caption = "Graph 4";
        chart.setData(param,150);
    }
}
Reserved words
Sum, Avg, Count, Date, Time


