QtRptDesigner
You may make xml file of the report in any text editor program. Or use any xml editor. Or use QtRPT Designer. How to use it, please check out our video file.
Bands in QtRPT
Bands are used for placing the objects they contain at particular locations on the output page.
For example, when placing an object in the "PageHeader" band we tell the report engine that the
given object must be displayed at the top of each page in the finished report. Similarly, objects in the
"PageFooter" band are displayed at the bottom of each page.
After starting of the QtRptDesigner , you will see a empty report. Now you add a new band. Click the "Insert band"
button on the object toolbar and select "appropriate band from drop-down list. We see a new band is added to the page.
QtRptDesigner automatically positions bands on the page - according the bands priority.
Fields' navigation by keyboard
You may move and change size of the fields by mouse. But sometimes it is necessary to do it more accurately using the keyboard.
Select field, hold down Ctrl key and press Up/Down/Left/Right key. In this case the field will moved to appropriate side.
To change the size of the field, hold down Shift key and press Up/Down/Left/Right key.
To select multiple fields, select one field, then hold down
Shift key, and then click on another field. You may simultaneously move and resize fields.
You can also group the selected fields, which will serve as one of the field during the selection.
How to use the field in the QtRptDesigner?
If you want enter some static text, you directly enter it. Into the field, you may enter the variable and some functions.
The variable will read the data from your program. The variable has to be limited from both sides by ‘[’ and ‘]’.
The QtRPT has some embedded functions such as:
<Date> - for printing current date
<Time> - for printing  current time
<Page> - for printing  number of current page
<TotalPages> - for  printing Total Pages of report
<LineNo> - for  printing Current record number of the Master Data band
Example: Let's assume you bring in a field the next line
Hello [FirstName], today is <Date> and now is <Time>. This prints on the <Page> page.
During the printing, the variable [FirstName] will be retrieved from the program, let's assume (Aleksey Osipov), so we will have the following:
Hello Aleksey Osipov, today is 18.06.2013 and now is 23:16:52. This print on the 1 page;
Built-in functions
You may use in the fields mathematical expressions and some aggregate/text/math functions which can use to calculate sum, average and count such as
Aggregate functions
- Sum – sum the value of the field
- Avg – average value of the field
- Count – count the value of the field
- Max – max value of the field
- Min – min value of the field
Text functions
- NumberToWords (ENG) – transfer the number to words (English)
- NumberToWords (GER) – transfer the number to words (German)
- NumberToWords (ESP) – transfer the number to words (Spanish)
- NumberToWords (ITA) – transfer the number to words (Italian)
- NumberToWords (FR_*) – transfer the number to words (French)
- NumberToWords (AR) – transfer the number to words (Arabic)
Math functions
- Frac – return the fractal part of number (double)
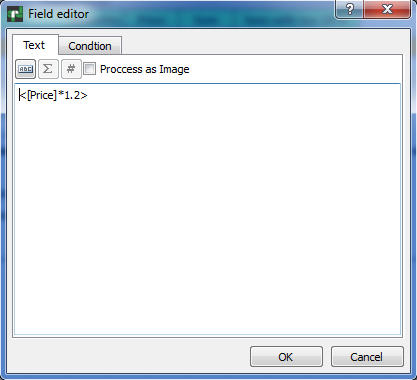
Example:
- Multiply the variable [Price] on 1.2 - <[Price]*1.2>
- Sum of the two aggregate functions - <sum([Quantity]) + sum([Price])>
- Multiply float on aggregate function - <sum([Sum]) * 1.2>
- Average price - <Avg([Price])>
- Return Frac part of number, return 45 - <Frac(3.45)>
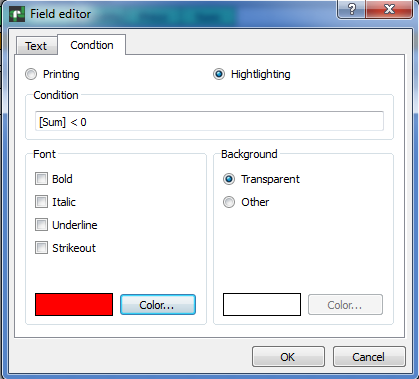
How to use Conditions in the fields in the QtRptDesigner?
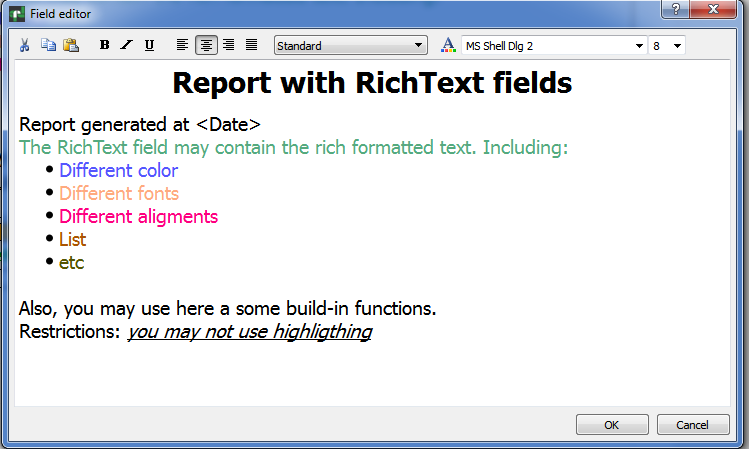
Rich Text field editor
To edit the field "RichText", double click on the chosen container. The dialog box in which you can bring the text will open, change its property.
You may change font’s property such as Bold, Italic, Underline, change the color of the text. This field also supports system variables and work with external data.
However this field doesn't support work with conditions, such as change of color registration depending on value of data.
Adding variables
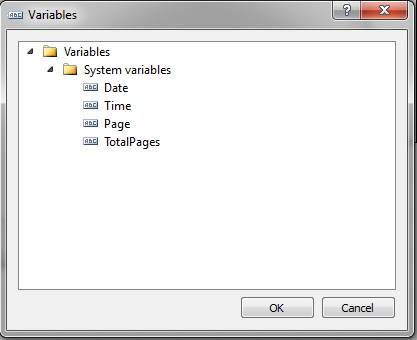
This dialog allows to insert different system variables in a report, such as a date, time, number of page and total pages in a report.
Adding functions
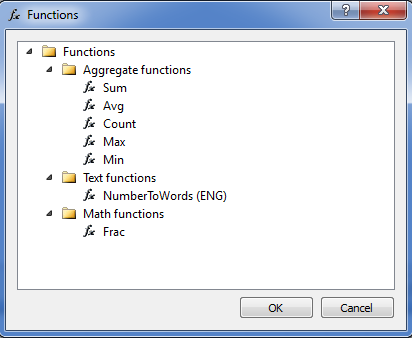
This dialog allows to insert different aggregate, text and mathematical functions in a report .;
Adding formatting
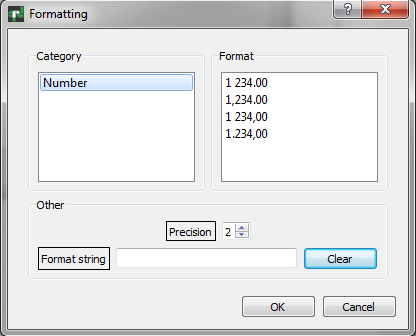
This dialog allows to produce formatting of digital value to the set kind.;
Diagram’s parameters
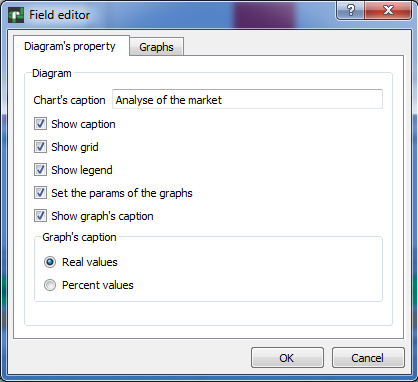
This dialog allows to setup parameters as a diagram must to look. On the tab "Diagram’s property" you can set common properties of diagram. On the tab of "Graphs" you may specify parameters for every separate graph.;
Graph’s parameters
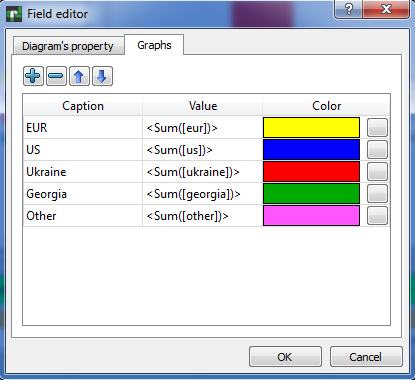
On this tab you can set parameters for every separate graph of diagram. You can set up order, caption, color and value.;
Settings
Set the designer options.
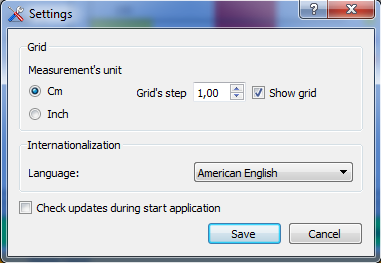
Here you can set the preferred units (centimeters, inches) and grid spacing and visibility.
You can set the language of the QtRptdesigner.
If you want that during the lanch QtRptDesigner checks updates from Internet, please check “Check updates during start application”.
Data group property
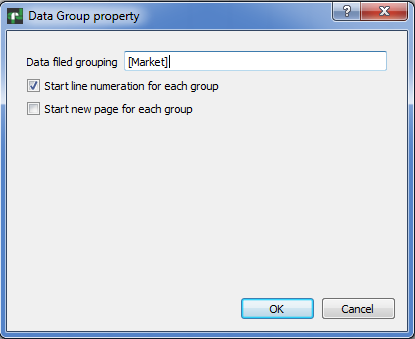
This dialog allows to set the field of grouping. And also whether numeration must to begin again for every group. In addition you can set that every group starts print from a new page.;
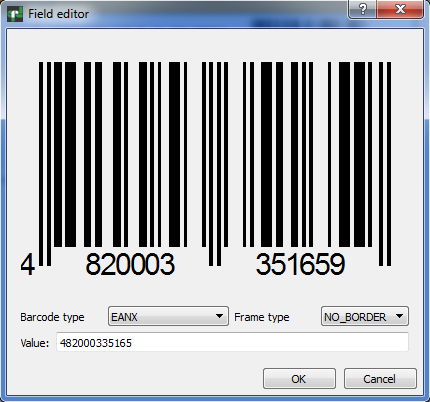
Barcode property
Please note: that since version 1.4.5, to use barcode feature, you need to have built QtZint library. The source files are in folder Zint-2.4.4.
After building, place (QtZint.dll, QtZint.so file) library into the folder where your application able to find it.
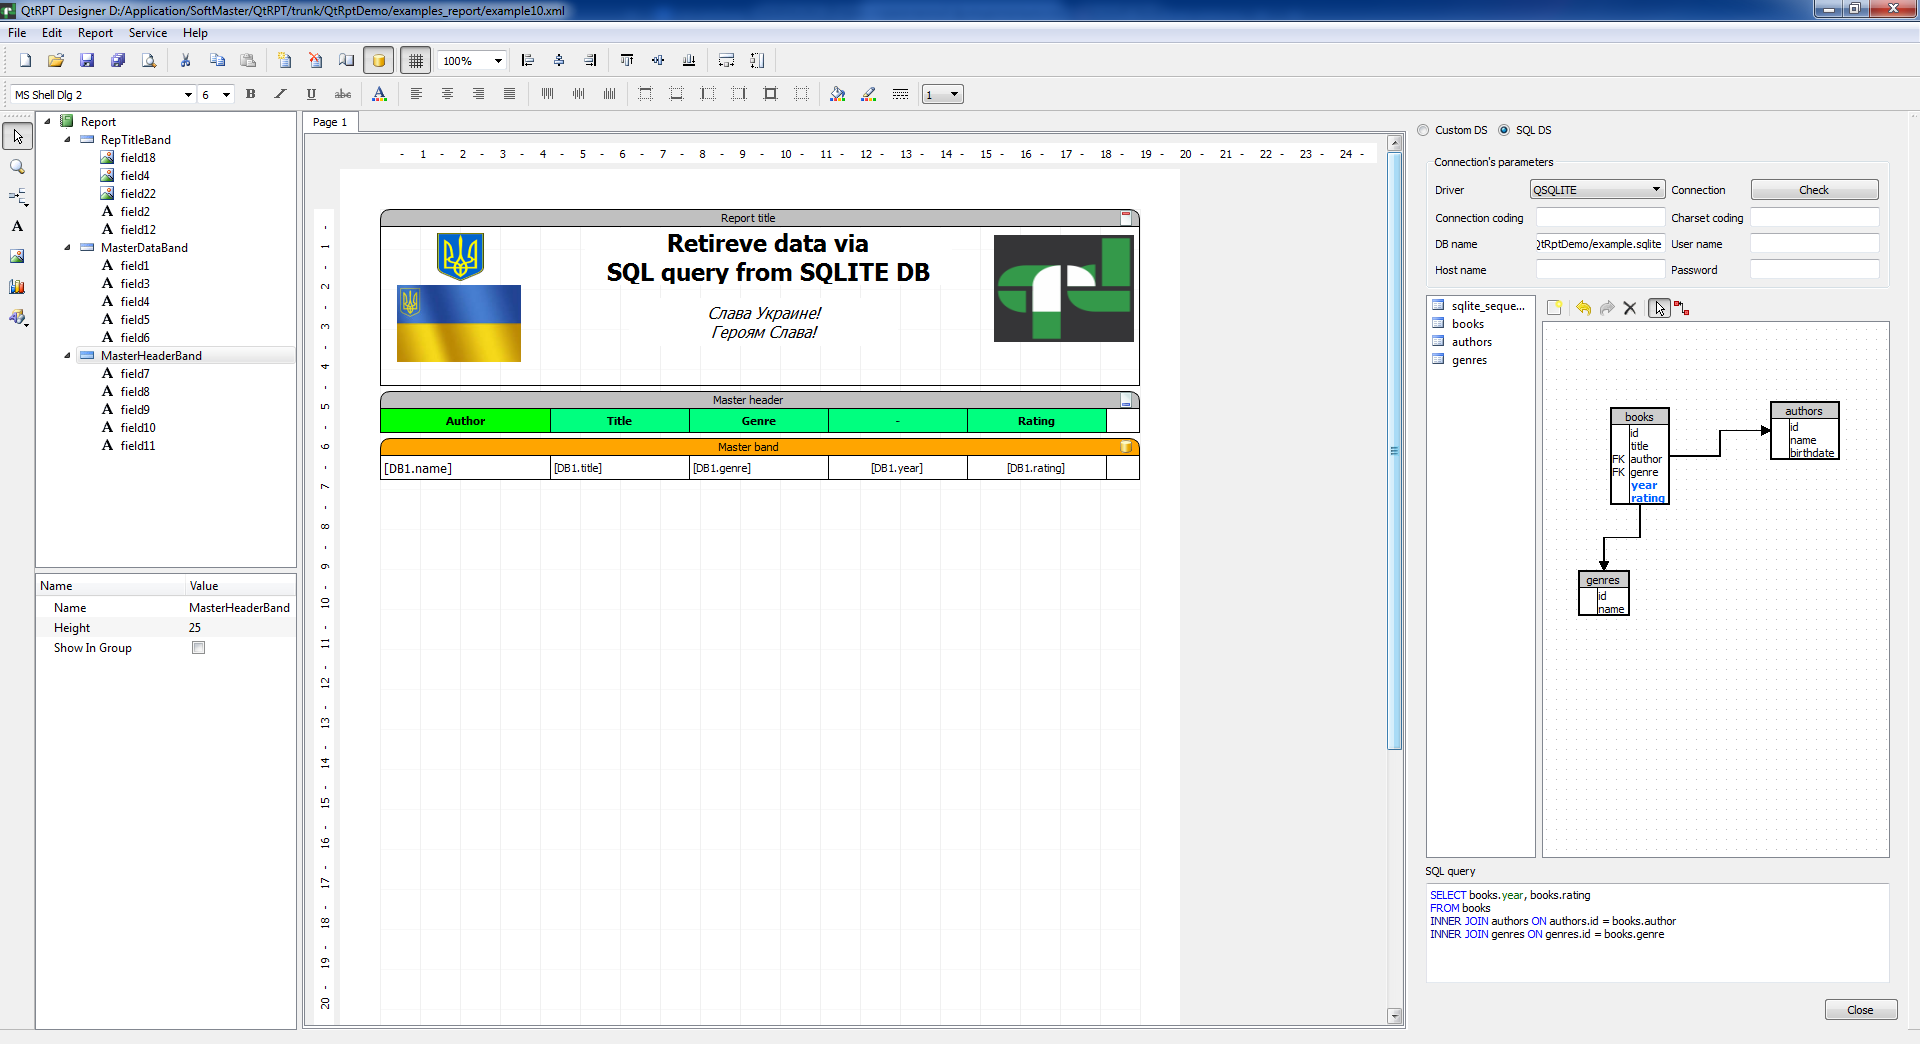
SQL Query Designer
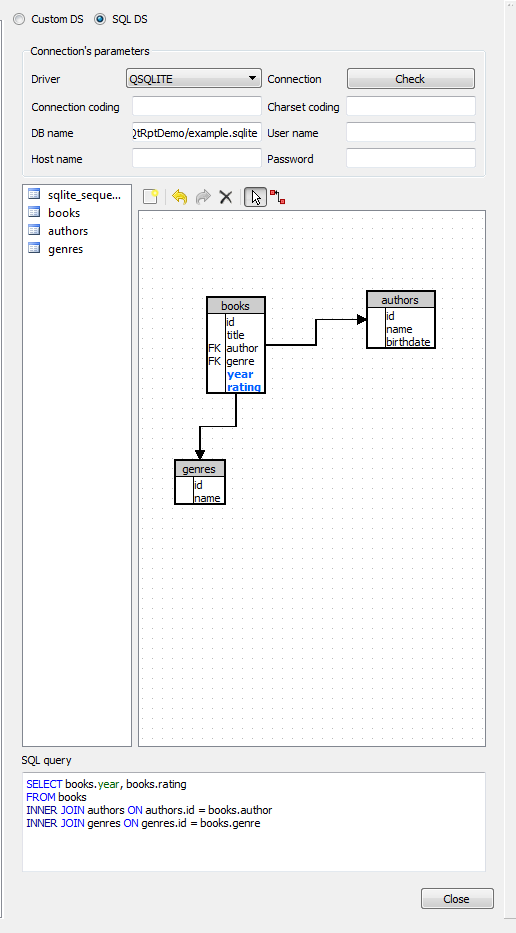
SQL Query Designer allows connects to DB. After connection you may drag and drop table from table’s tree to the diagram.
You may establish a relationship between some tables. Setup a properties of the relationship. During visual modeling the SQL query is automatically generated.
At any time you may correct the SQL query.
Script editor
Script editor allows to enter scripts, which will be executed during report building. Script allows to carry out the some control of process of report building. The following objects are available in the script engine.
QtRPT name of QtRPT instance in the script engine has following properties, members and functions
- pageList - list of the RptPageObject
RptPageObject represents report page, and it has the following properties, and functions
- setVisible(bool value) - makes report report page visible/invisible
RptFieldObject
- value - value of the filed, including variables
- width - width of the field
- height - height of the field
- top - top of the field
- left - left of the field
- visible - visibility of the field
- rotate - rotation of the field
- fontColor - color of the font
- backgroundColor - background color
The examples of some command:
To get the list of report pages: debug(QtRPT.pageList);
To get count of report pages: debug(QtRPT.pageList.length);
To get the report page name: debug(QtRPT.pageList[0].objectName);
for debugging, you can use print or debug function print in QtCreator word TEST + value of variable [var1]
debug('TEST:' + [var1]);
print('TEST:' + [var1]);
checking the value of variable var1 from user application
and makes report page visible/invisible depends of value.
Please note, that here only first value of variable will be taken
If you want to process each value of variable from data set, you must
place such processing in the function of appropriate field
Common section
not depends from order of the fields and evaluate as
as report starts
if ([var1] > 1000)
     QtRPT.pageList[0].setVisible(false);
else
     QtRPT.pageList[0].setVisible(true);
Define function for field processing
To process field, you must define function with name field1 before getting data from user application/
VERY IMPORTANT!
The name functions must be as
nameOfField+BeforeData
or nameOfField+AfterData
BeforeData functions will be executed before start of processing appropriate field
AfterData function will be executed after getting data from user application
Examples
function field1BeforeData()
{
   // making the field visible/invisible depends of value
   if ([var1] > 1000) {
      field1.visible = false;
      field1.value = 'HELLO, I am invisible'; // assigning the value to the field
   } else {
      field1.visible = true;
   }
}

/*Processing field with name field1 after getting data from user application
Please note, that use After function preferably only for changing text value of the field
*/
function field1AfterData(value)
{
   /*This function mainly intended for modifing of result string.
   DONT use the following settings in AFTER section
   Field1.visible = false;

   If you DONT want to change value string, just comment 'return'
   Here we modified the value that comes from user application and add
   the string to it*/
   field1.fontColor = QColor(255,0,0);
   return value + " It is corrected string";
}

/*Here we rotate the field*/
function field2BeforeData()
{
   var w = field2.width;
   var h = field2.height;
   field2.rotate = 3;
   field2.height = w;
   field2.width = h;
}

/*Here we change the width of field3, set the same as field4 has*/
function field3BeforeData()
{
   field3.value = 'We change width of the field';
   field3.width = field4.width;
}

/*Here we set the font and background color*/
function field4BeforeData()
{
   field4.value = 'We change the color of font and background';
   field4.fontColor = QColor(0,255,0);
   field4.backgroundColor = QColor(255,0,0);
}

/*Making field invisible*/
function field6BeforeData()
{
   field6.visible = false;
}


